ODI cricket environments evolved significantly from 1971 through current scheduling frameworks, affecting batting performance sustainability.
Early ODI phases featured bowler-dominant conditions with limited boundary dimensions and slower over rates, while modern periods involve batting-friendly pitch preparations and accelerated scoring requirements.
Average match scores increased from 200-220 (1980s) to 280-300 (2020s), directly influencing performance consistency thresholds for ranking maintenance.
The players with most days as No. 1 ODI batter in Cricket History operated within distinct environmental contexts affecting baseline performance expectations and ranking volatility patterns.
Scheduling density, pitch standardization protocols, and format rule modifications created varying sustainability requirements across a five-decade timeline.
Players with Most Days as No. 1 ODI Batter in Cricket History
Environmental factors influenced ranking longevity independent of individual skill levels.
Top 5 players with Most days as No. 1 ODI batter
| Rank | Player | Country | Days at No.1 | Avg ODI Scores (Era) | ICC Era |
|---|---|---|---|---|---|
| 1 | Viv Richards | West Indies | 2306 | 215-230 | 1984-1991 |
| 2 | Brian Lara | West Indies | 2079 | 235-255 | 1998-2007 |
| 3 | Virat Kohli | India | 1547 | 275-290 | 2017-2021 |
| 4 | Michael Bevan | Australia | 1361 | 240-260 | 1999-2003 |
| 5 | Babar Azam | Pakistan | 1359 | 280-300 | 2021-2024 |
Average scoring environments increased 35% from early ODI establishment through modern batting-friendly conditions.
The ODI Batsman With Most Days at No.1 Ranking in Cricket History performed within the lowest scoring environment, averaging 215-230 per innings, requiring different consistency thresholds compared to modern 280-300 scoring baselines.
ODI Environment Comparison During No.1 Rankings
| Era | Avg Match Scores | Bowling Conditions | Ranking Volatility |
|---|---|---|---|
| Early Establishment (1984-1991) | 215-230 | Bowler-dominant, seam-friendly | Low |
| Pre-T20 Era (1998-2007) | 235-260 | Balanced, moderate assistance | Medium |
| Modern Era (2017-2024) | 275-300 | Batting-friendly, flat surfaces | High |
5. Babar Azam – 1359 Days
Babar Azam maintained a 1,359-day ranking tenure within a modern high-scoring environment, averaging 280-300 per innings.
Batting-friendly pitch preparations reduced performance differentiation margins, requiring higher absolute outputs to maintain rating advantages over expanded competitive fields playing under identical favorable conditions.
Modern ODI conditions feature standardized pitch protocols producing consistent bounce and minimal lateral movement.
Azam’s ranking sustainability required maintaining 55+ averages when the era baseline reached 40-45, compared to historical periods where 45+ averages provided greater rating separation within players with most days as No. 1 ODI batter in Cricket History.
| Environmental Factor | Value |
|---|---|
| Days at No.1 | 1,359 |
| Era Avg Score | 280-300 |
| Pitch Conditions | Batting-friendly, flat |
| Era Baseline Average | 40-45 |
4. Michael Bevan – 1361 Days
Michael Bevan operated during the 1999-2003 period with moderate scoring environments averaging 240-260 per innings.
Pre-T20 era conditions featured balanced pitch preparations providing equal opportunities for batting accumulation and bowling penetration, supporting sustained ranking positions through consistent middle-order performances.
Bevan’s 1,361-day tenure coincided with the two-new-ball rule implementation affecting death-over scoring patterns.
Environmental conditions during this phase produced lower volatility compared to modern batting-dominant surfaces, allowing ranking maintenance through steady 50-55 average outputs without requiring explosive strike rates.
| Environmental Factor | Value |
|---|---|
| Days at No.1 | 1,361 |
| Era Avg Score | 240-260 |
| Pitch Conditions | Balanced, moderate assist |
| Era Baseline Average | 32-37 |
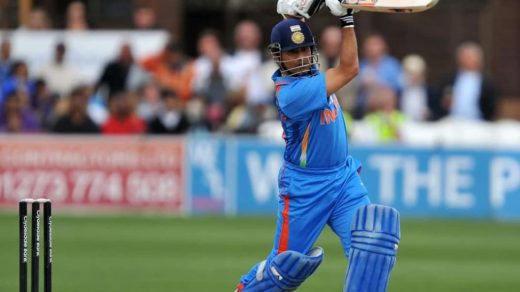
3. Virat Kohli – 1547 Days
Virat Kohli accumulated 1,547 ranking days during the modern batting-friendly environment, averaging 275-290 per innings.
Standardized pitch preparations across international venues reduced environmental variability, requiring consistent performance across uniform high-scoring conditions to maintain rating point accumulation above competitive depth.
Kohli’s 2017-2021 period featured limited seam movement and reduced swing assistance due to pitch flattening trends.
Environmental homogenization increased competition density as multiple batters achieved similar outputs under favorable conditions, producing fragmented ranking patterns with 11 separate No.1 stints across a four-year window.
| Environmental Factor | Value |
|---|---|
| Days at No.1 | 1,547 |
| Era Avg Score | 275-290 |
| Pitch Conditions | Batting-dominant, standardized |
| Era Baseline Average | 38-43 |
2. Brian Lara – 2079 Days
Brian Lara maintained a 2,079-day tenure during a transitional scoring environment, averaging 235-255 per innings.
His Most Consecutive Days as No.1 ODI Batter reached 892 days through the 1998-2000 period when pitch conditions shifted from seam-assistance toward batting-friendly preparations, affecting ranking sustainability requirements.
Lara’s era represented an environmental transition between traditional bowler-favorable surfaces and modern flat pitches.
This intermediate phase produced medium ranking volatility as scoring environments stabilized around 250-run baselines, allowing extended ranking positions through 40-45 average maintenance when era baselines remained 30-35.
| Environmental Factor | Value |
|---|---|
| Days at No.1 | 2,079 |
| Era Avg Score | 235-255 |
| Pitch Conditions | Transitional, improving for batting |
| Era Baseline Average | 30-35 |
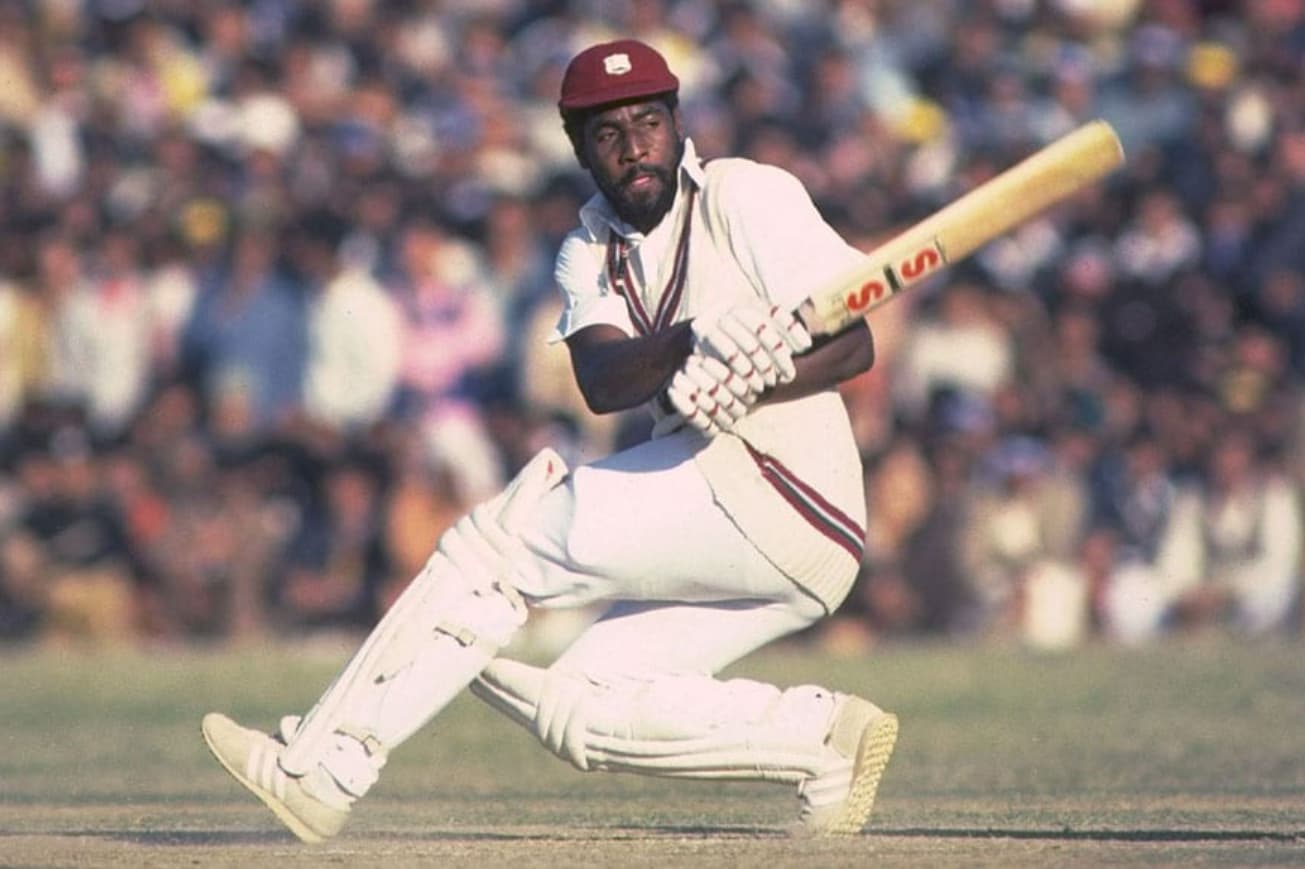
1. Viv Richards – 2306 Days
Viv Richards achieved a 2,306-day record within a bowler-dominant environment, averaging 215-230 per innings.
Richards represents the batsmen who held the No.1 ODI rank for most consecutive days during the early ODI phase, featuring seam-friendly pitches with inconsistent bounce and limited boundary dimensions, reducing scoring opportunities.
Richards’ 1984-1991 period featured natural pitch conditions without artificial flattening preparations.
His 47 average exceeded the era baseline by 15-18 runs when scoring environments favored bowling attacks, providing substantial rating margins within a low-volatility ranking system operating under annual recalculation cycles and limited competitive depth.
| Environmental Factor | Value |
|---|---|
| Days at No.1 | 2,306 |
| Era Avg Score | 215-230 |
| Pitch Conditions | Bowler-dominant, variable bounce |
| Era Baseline Average | 28-32 |
Conclusion:
Environmental analysis of players with most days as No. 1 ODI batter in Cricket History reveals systematic correlations between conditions and ranking longevity:
- Scoring environment increases from 215 (1980s) to 300 (2020s) compressed performance differentiation margins by 35%
- Bowler-dominant conditions (1984-1991) produced the longest ranking durations, averaging 2,306 days through greater performance separation
- Batting-friendly pitch standardization (2017-2024) reduced ranking sustainability to 1,359-1,547 days through environmental homogenization
- Era baseline averages rose from 28-32 (early period) to 40-45 (modern period), requiring proportionally higher outputs for rating advantages
- Environmental volatility inversely correlated with ranking duration across a five-decade timeline
- Pitch condition transitions directly influenced ranking system volatility patterns, independent of calculation methodology changes
Also Check: